The Different Shades of Tree Equity in Seattle Neighborhoods
First we hit 100. Then 104. Then—108 degrees? How, we wondered. Even in this environmentally conscious city, last June’s record-breaking heat dome was both a wakeup call for AC holdouts and a death knell. Across Washington, 157 lost their lives from heat-related illnesses during the summer of 2021, compared to just seven the previous year. The heat wave was the state’s deadliest weather event ever.
Shortly thereafter, president Joe Biden rolled out a nearly $2 trillion Build Back Better plan that included the words “tree equity.” A GOP punchline was born. Three billion dollars…for woke maples? This snarking missed the forest: With climate change bringing scorching temperatures, dense areas with little shade—often in places with lower incomes— have become death traps for vulnerable residents. Planting trees in these communities could help them weather the next environmental disaster, the thinking goes.
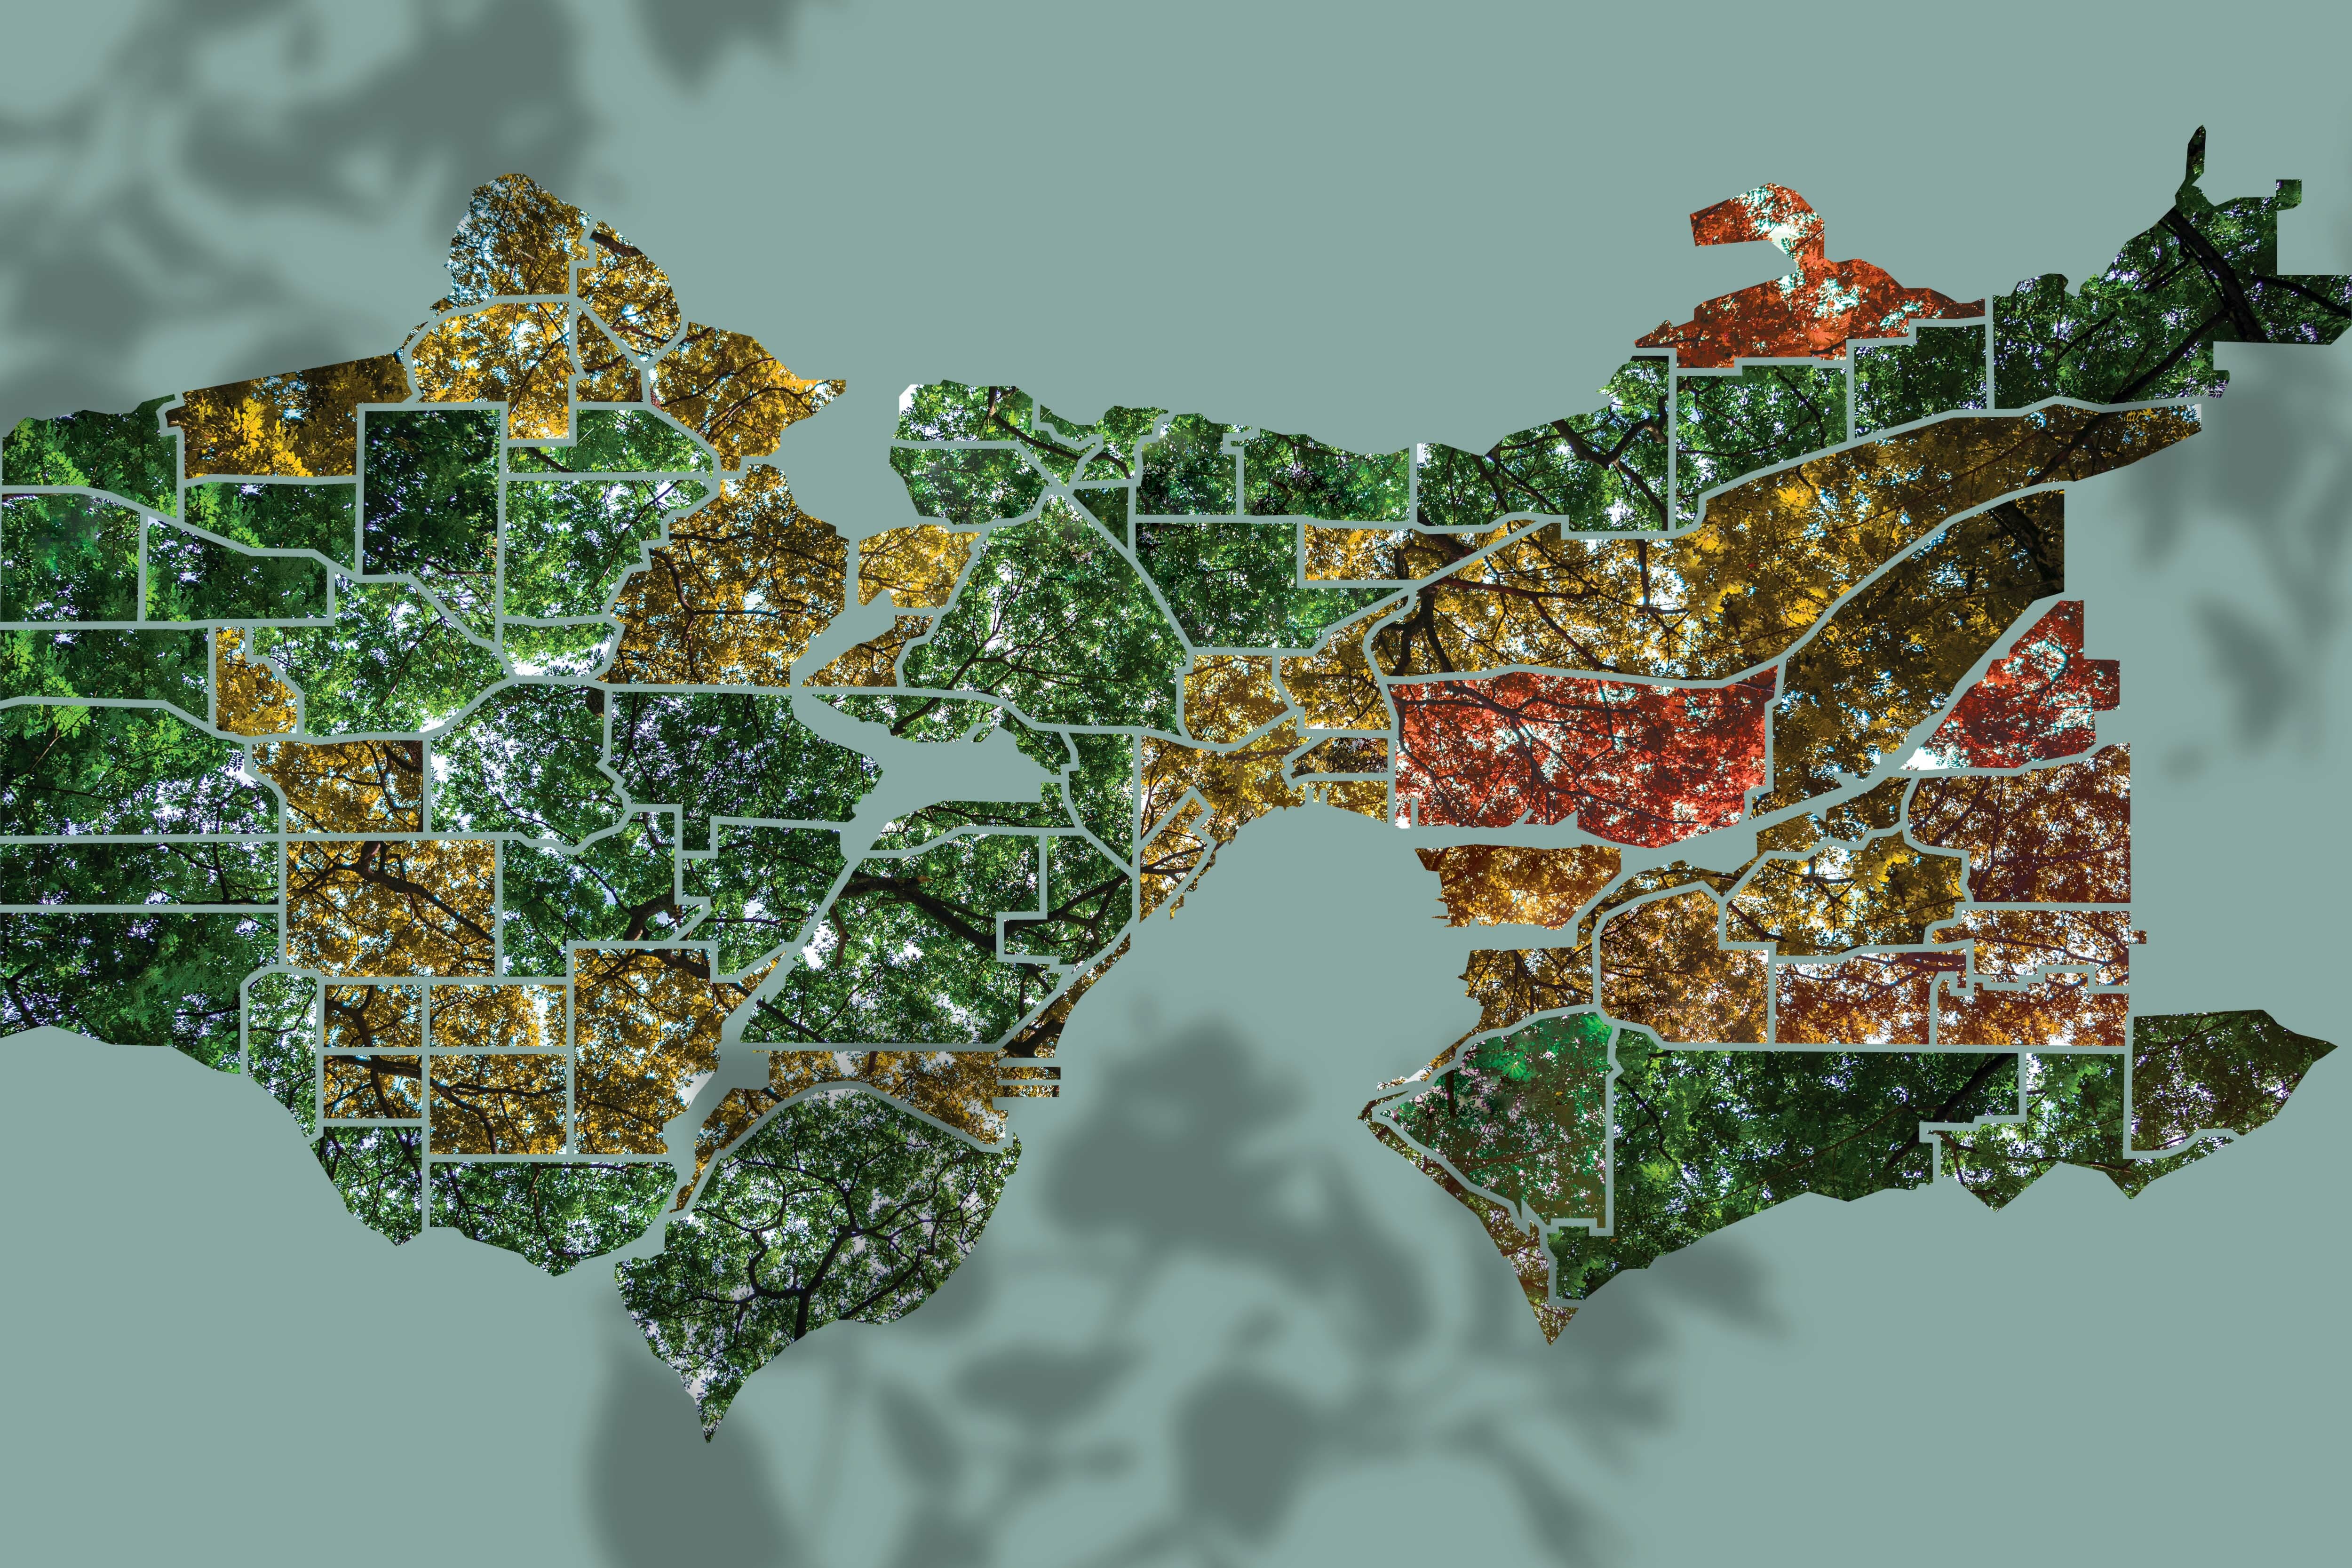
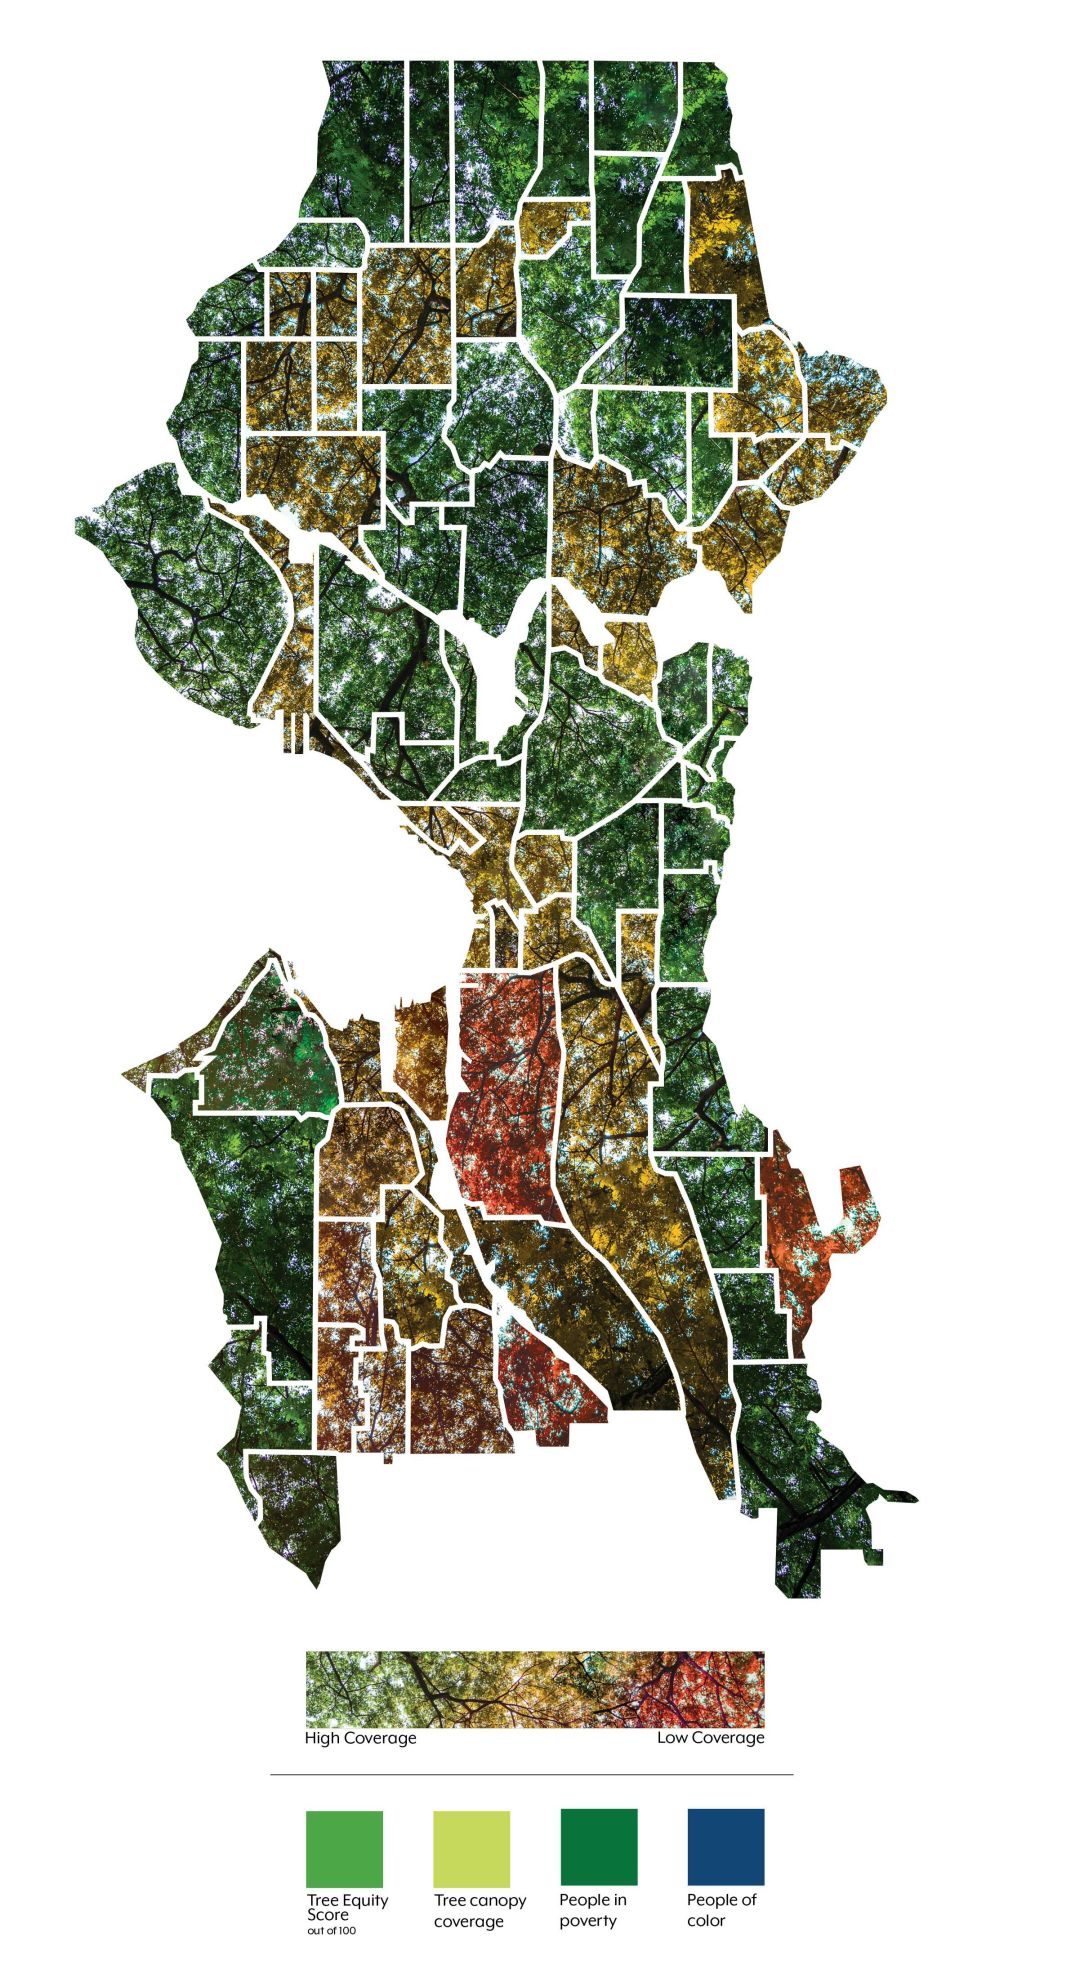
Evergreen as we may be, these urban heat islands exist here too. Nonprofit American Forests has mapped our city and others, giving each census block a tree equity score based on racial diversity, age, income level, health, surface temperatures, and, of course, tree canopy coverage. The results highlight that more than just geography separates South Seattle from the north.
Rainier Valley
(Census Block Group 530330110012)
Tree Equity Score ► 59
Tree canopy coverage ► 15 percent
People in poverty ► 65 percent
People of color ► 78 percent
Max temp. on July 27, 2020: 93 degrees
Heat Check
On July 27, 2020, the temperature at Sea-Tac Airport was 94 degrees—the number you might see reported on local news for Seattle. But how did the temperature on the tarmac compare to, say, the warm breeze at Golden Gardens? Seventeen volunteers traveled across King County with tubes attached to their cars to find out. Supplied by a consulting firm, these sensors collected heat data during the morning, afternoon, and evening. The 110,000 measurements produced wildly different results. Temperatures varied by as much as 23 degrees at one point, with concrete and tall buildings trapping more hot air. On the Ballard shore that afternoon, though, it was a balmy 83.
Icon: The Noun Project
South Park
(Census Block Group 530330112001)
Tree Equity Score ► 59
Tree canopy coverage ► 15 percent
People in poverty ► 47 percent
People of color ► 66 percent
Max temp. on July 27, 2020: 91 degrees
Georgetown
(Census Block 530330109002)
Tree Equity Score ► 64
Tree canopy coverage ► 6 percent
People in poverty ► 27 percent
People of color ► 34 percent
Max temp. on July 27, 2020: 94 degrees
Broadview
(Census Block Group 530330005001)
Tree Equity Score ► 100
Tree canopy coverage ► 66 percent
People in poverty ► 3 percent
People of color ► 11 percent
Max temp. on July 27, 2020: 90 degrees
Lake City
(Census Block Group 530330002006)
Tree Equity Score ► 100
Tree canopy coverage ► 42 percent
People in poverty ► 22 percent
People of color ► 20 percent
Max temp. on July 27, 2020: 88 degrees
Ravenna
(Census Block Group 530330043013)
Tree Equity Score ► 100
Tree canopy coverage ► 52 percent
People in poverty ► 12 percent
People of color ► 11 percent
Max temp. on July 27, 2020: 90 degrees

Climate Range
Washington’s Weirdest Weather

Data Driven
The Fight Over Data Centers Next Door

Feature
The Tree of Life Is Falling Down

Alfresco Film