Real Estate Listings Are Up in Seattle
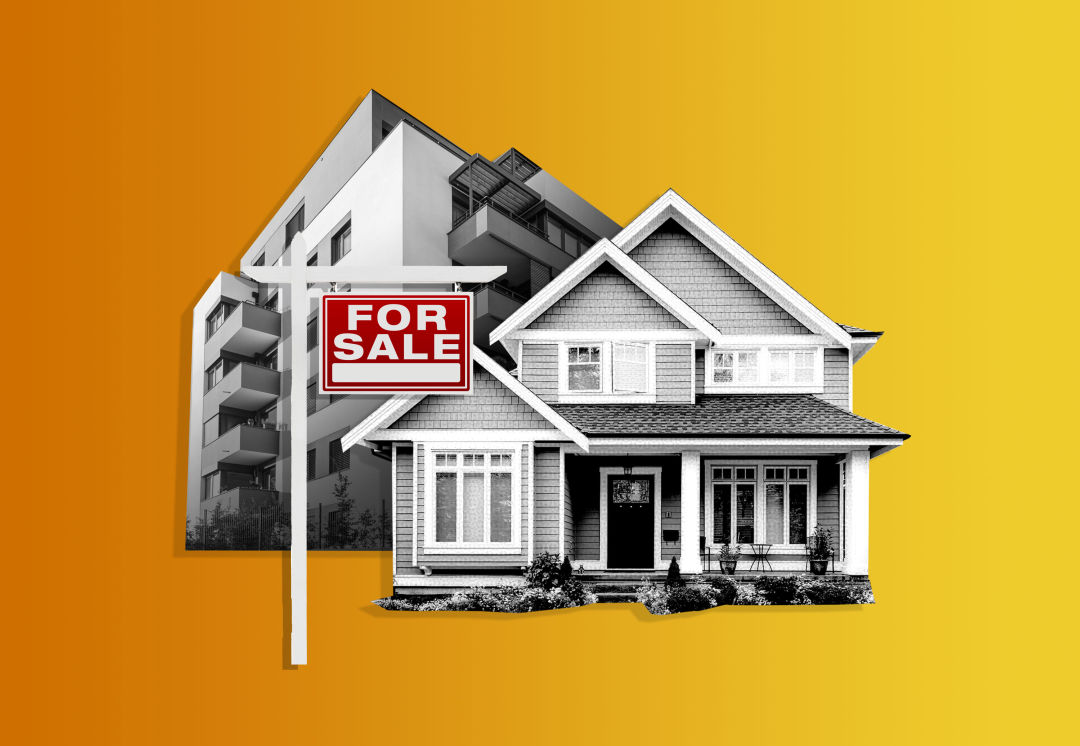
There are more homes for sale around the Seattle area, but purchasing one continues to get more expensive, the latest data from the Northwest Multiple Listing Service (NWMLS) show. The median sale price in King County was $880,000 in July, up 7.25 percent relative to the same time last year. Active listings jumped 39.5 percent.
But maybe it’s not all high-priced, dour news.
“The housing market is loosening up,” with a likely cut to interest rates on the horizon, the NWMLS notes. And buyers did come back to the table, after taking a little break—closed sales increased 7.25 percent county-wide.
While any change in mortgage rates is expected to be small, Seattle Times reports, buyers and sellers are ready to pounce at the first sign of a dip. To help you get ahead of the potential feeding frenzy, we looked at the larger market picture for this month’s snapshot. Here are the areas in King County where prices are gaining and falling the fastest.
List ordered by annual price growth.
Falling prices
2. Southeast King County
Active listings in this king-size part of King County were up 52 percent in July, and sales ticked up 4 percent. While on the whole prices took a small dip, the Skyway area was the biggest loser. There the median price dropped 19 percent to $605,500, even as (a low volume of) active listings nearly tripled over last year and sales jumped 58 percent. On the other end of the southeast price spectrum, the median price in Black Diamond/Maple Valley increased 6 percent to $829,950. Closed sales were down a smidge (1 percent), and active listings increased 33 percent.
Median price: $695,000
Year-over-year price growth: -1.97 percent
Months of inventory: 1.97
1. Southwest King County
All the southwest suburbs took a price hit in July. Closed sales were down 6 percent, but active listings skyrocketed 61.5 percent—the most in King County. Des Moines/Redondo had the most affordable median price after it fell 6.25 percent to $562,499.
Median price: $590,000
Year-over-year price growth: -3.3 percent
Months of inventory: 1.9
Prices rising
4. Vashon
Real estate in this community had a small price bump in July, but there are only so many homes on the island. Active listings were up just 8.7 percent, and closed sales increased 23 percent over last year.
Median price: $772,500
Year-over-year price growth: 3.7 percent
Months of inventory: 1.6
3. North King County
With the light rail extension, it’s no surprise that inventory in the northern suburbs is tight, even as active listings increased 33.7 percent. The median price in Richmond Beach/Shoreline increased nearly 6 percent, and closed sales fell 23 percent. In Lake Forest Park, closed sales increased 22 percent, while the median price remained unchanged.
Median price: $847,500
Year-over-year price growth: 4.6 percent
Months of inventory: 1.5
2. Seattle
While active listings in the city increased 40.8 percent, prices also increased—up 8 percent. But closed sales inched about 1 percent over last year. In Belltown/Downtown, active listings—all condos—were up 22.3 percent, and so was the price, which increased 22.7 percent to $650,000. That was the largest hike in the city. However, closed sales—also all condos—had the largest drop in the entire county—falling 28 percent.
In North Seattle, the median price climbed back in the millions—$1,035,000—after a 20 percent bump in July. Active listings were up 45.6 percent, and closed sales posted a nearly 9 percent increase. Queen Anne/Magnolia reclaimed its spot as Seattle’s most expensive neighborhood, after the median price increased 16.9 percent to $1,245,000. Active listings soared nearly 60 percent, and sales were up 3 percent. SoDo/Beacon Hill posted the sole price decline in Seattle. Prices fell 5.1 percent to $650,000, as sales increased almost 30 percent. Active listings were also up about 30 percent.
Median price: $875,000
Year-over-year price growth: 8 percent
Months of inventory: 2.6
1. Eastside
Eastside prices popped off in July. So did closed sales, which were up 29 percent over last year. Inventory, however, did not—even with an almost 24-percent increase in active listings. The median price East of Lake Sammamish gained 23 percent ($1,475,000), and closed sales jumped 26.4 percent. However, active listings were up just 8.3 percent. In Bellevue, west of 405, active listings increased just 7.5 percent while closed sales increased almost 50 percent. The median price fell 9 percent to $1,865,000, which remains one of the most expensive enclaves on the Eastside. Mercer Island takes the top price spot: $2,220,000 after a 1.2 percent increase to median price in July.
Median price: $1,423,475
Year-over-year price growth: 11.7 percent
Months of inventory: 1.4


